Connected Health
How MIGHT WE empower people to understand and manage their health?
Timeframe: 4 week-long sprints
Tools: Coffee, Post-its, Pen & Paper
Role: User experience (UX) design, UX research, content strategy
My team of 4 designers was tasked with proposing designs for a companion app that would pair with our potential client’s existing blood pressure monitor. We were also asked to recommend market opportunities within holistic health for the company to explore. Along with the other UX designers, I performed a competitive analysis, created research assets and sketches, moderated and synthesized interviews, and refined concepts. Our visual designer then brought our sketches to life.
Overview


01. The Challenge
"About 75 million American adults (32%) have high blood pressure—that’s 1 in every 3 adults."— Centers for Disease Control and Prevention (CDC)
To help our potential client identify product and market opportunities, we spoke to 5 healthcare professionals (our subject matter experts) and 2 people living with or at risk of getting high blood pressure. We wanted to understand the problem and learn how people were managing their blood pressure health within the context of their broader lifestyle habits. The team focused on laying the foundation for further research and design iteration.
SME Interview Highlights
High BP is asymptomatic → There are no direct symptoms that may necessarily cause a patient to seek medical attention specifically for blood pressure. It can go unseen and untreated.
BP numbers need to be packaged into holistic monitoring → It’s not necessarily the daily BP readings that are important. Daily monitoring is useful to get people to engage or correlate contributing lifestyle factors to higher/lower BP.
BP is an extra dimension to fitness and health
Lifestyle changes are the biggest contributing factor to BP and hypertension → The same lifestyle changes that are used to prevent BP are the same ones used to treat it.
User Quotes
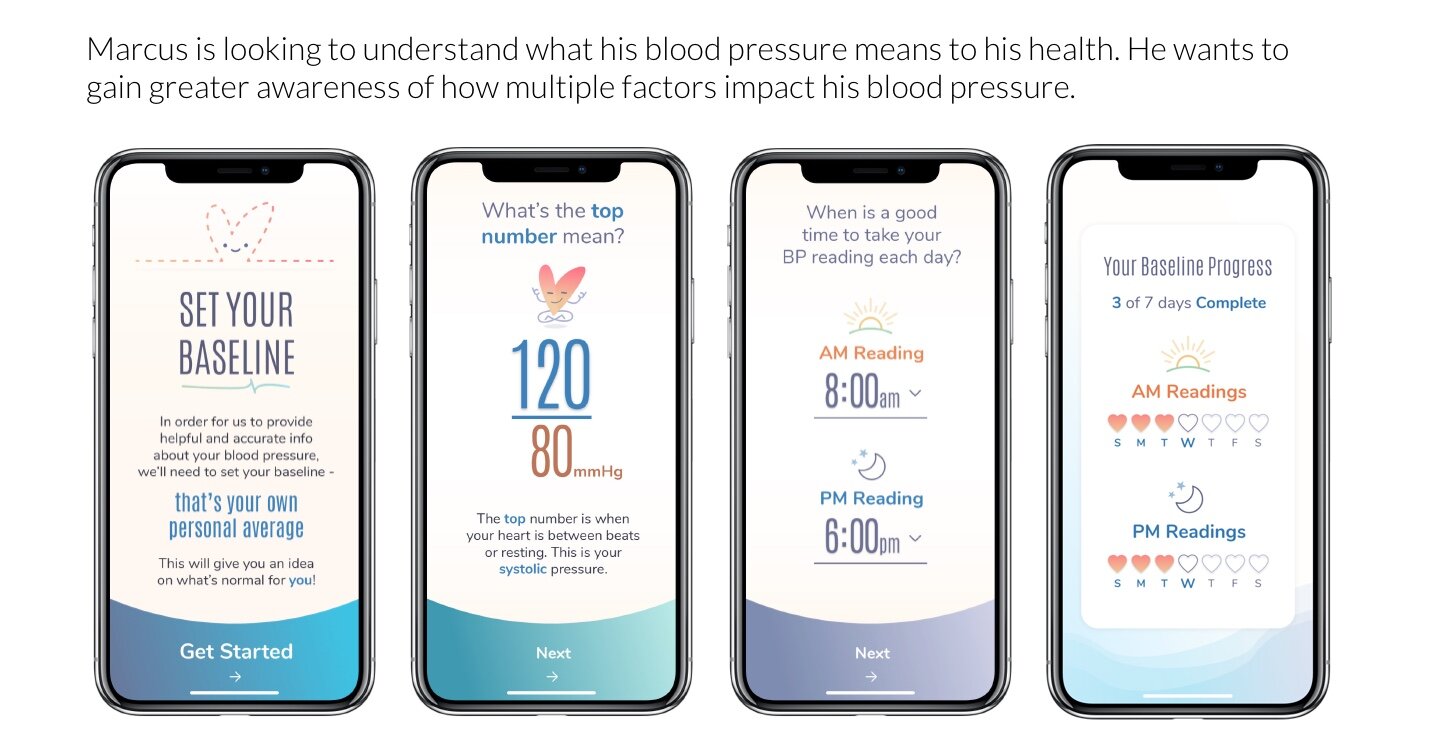
"Honestly, I’m embarrassed to say but I forgot what the two numbers mean.” — Marcus, 36
“I don’t think enough emphasis is placed on the correlation between stress and high bp. It wasn’t until I quit my stressful corporate job and my bp went from elevated to normal within 2 months of quitting that I realized just how strong the correlation is.” — Marcus
02. Initial Exploration
Here’s where we started…
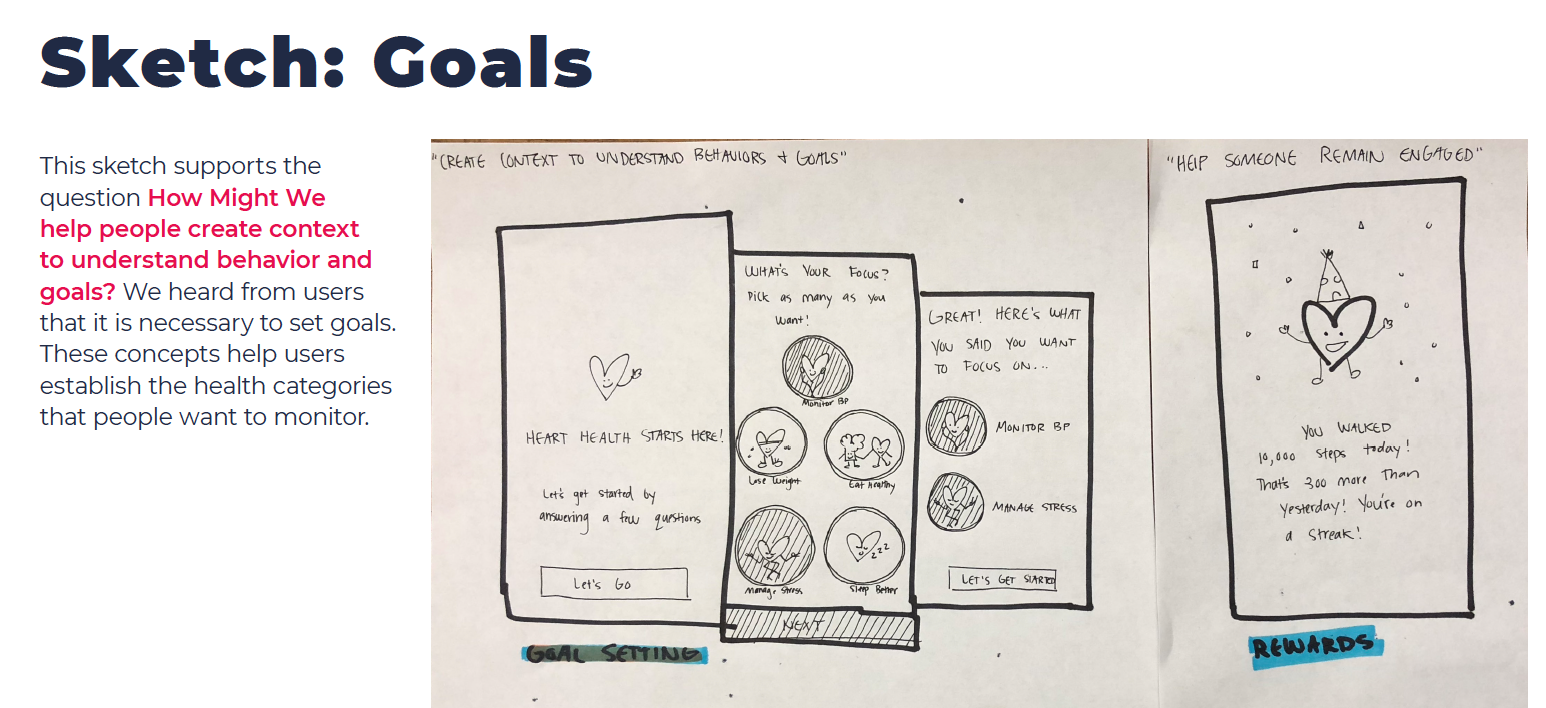
Initial ideas and sketches.
After talking to SMEs and potential users, we documented high-level findings and noticed patterns across the interviews. We then refined our sketches and worked with the visual designer to bring our ideas to life.
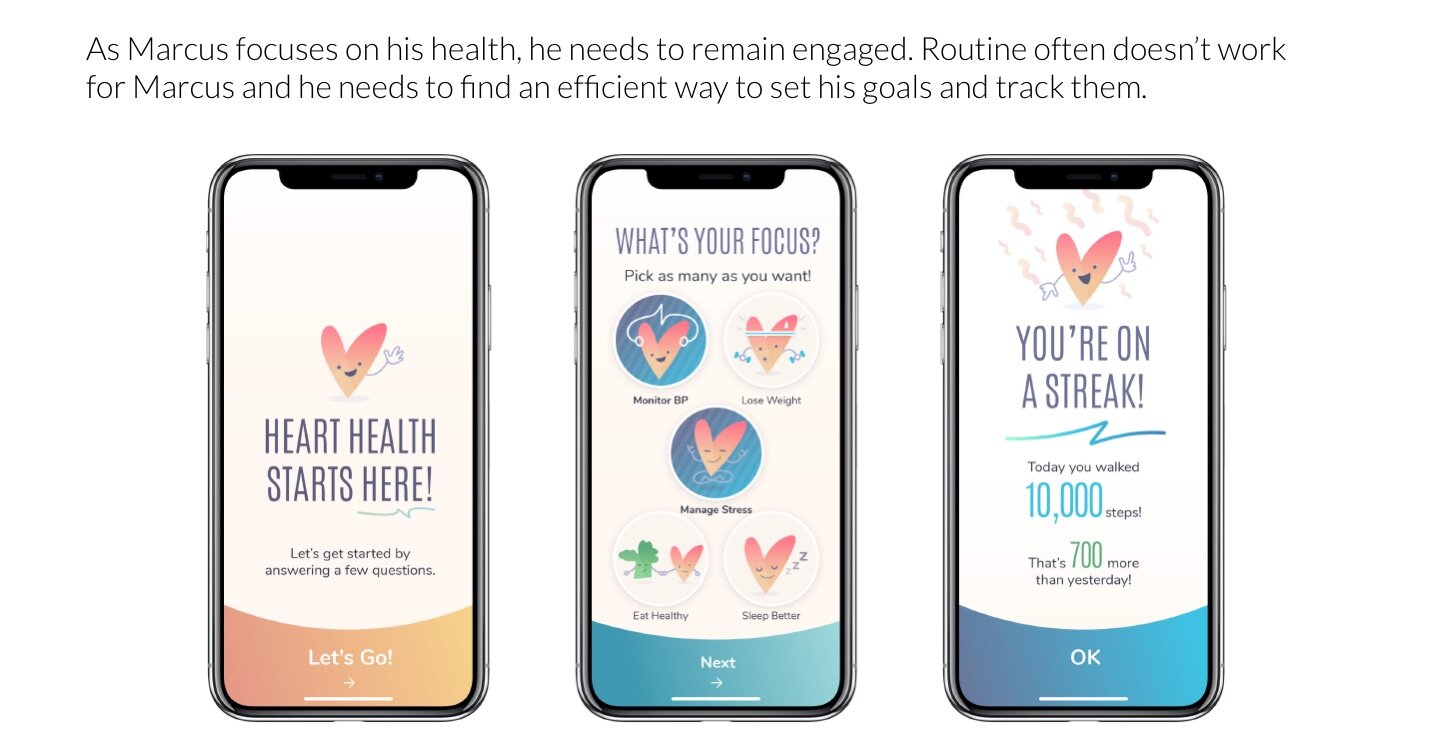
Our guiding principle: Make BP data actionable and make the exercise of checking BP delightful!
03. Our Solution
Awareness
Management
Engagement
04. Final Thoughts
Our CEO was proud to pitch our ideas, which were well-received by the client. While working on this project, I thoroughly enjoyed getting to know my fellow designers better and figuring out how best to highlight each other’s strengths. We rose to the challenge of delivering results quickly with limited resources. Though it was difficult at times, we ultimately figured out how to prioritize tasks and be honest with each other about what was and wasn’t feasible for delivery. Most importantly, we provided the client with a product development road map, which centered continuous user research.
A happy little accident.


